

Retail
Custom sales and inventory dashboards for retail owners.
Old North Analytics builds dashboards that turn your sales and inventory data into one view you can read at a glance, margin included. There are no monthly fees, and you own everything we build.
Start a conversationThe usual setup
If you run on register exports and gut feel, this probably sounds familiar.
The point of sale spits out reports, they land in a folder, and turning them into something you can act on never makes it to the top of the list.
Top sellers are easy to spot. Which products actually carry the store after cost is a question the reports do not answer.
What the shelf says and what the report says drift apart, so you reorder too late on the movers and sit on the rest.
Pulling a simple read on the week means another export and another round of cleanup before you even start looking.
What we build
One dashboard, built around the numbers that run your store.
We do not move you onto new software. We build inside the tools you already have, fed by the exports you already pull, and then we hand the whole thing over to you.
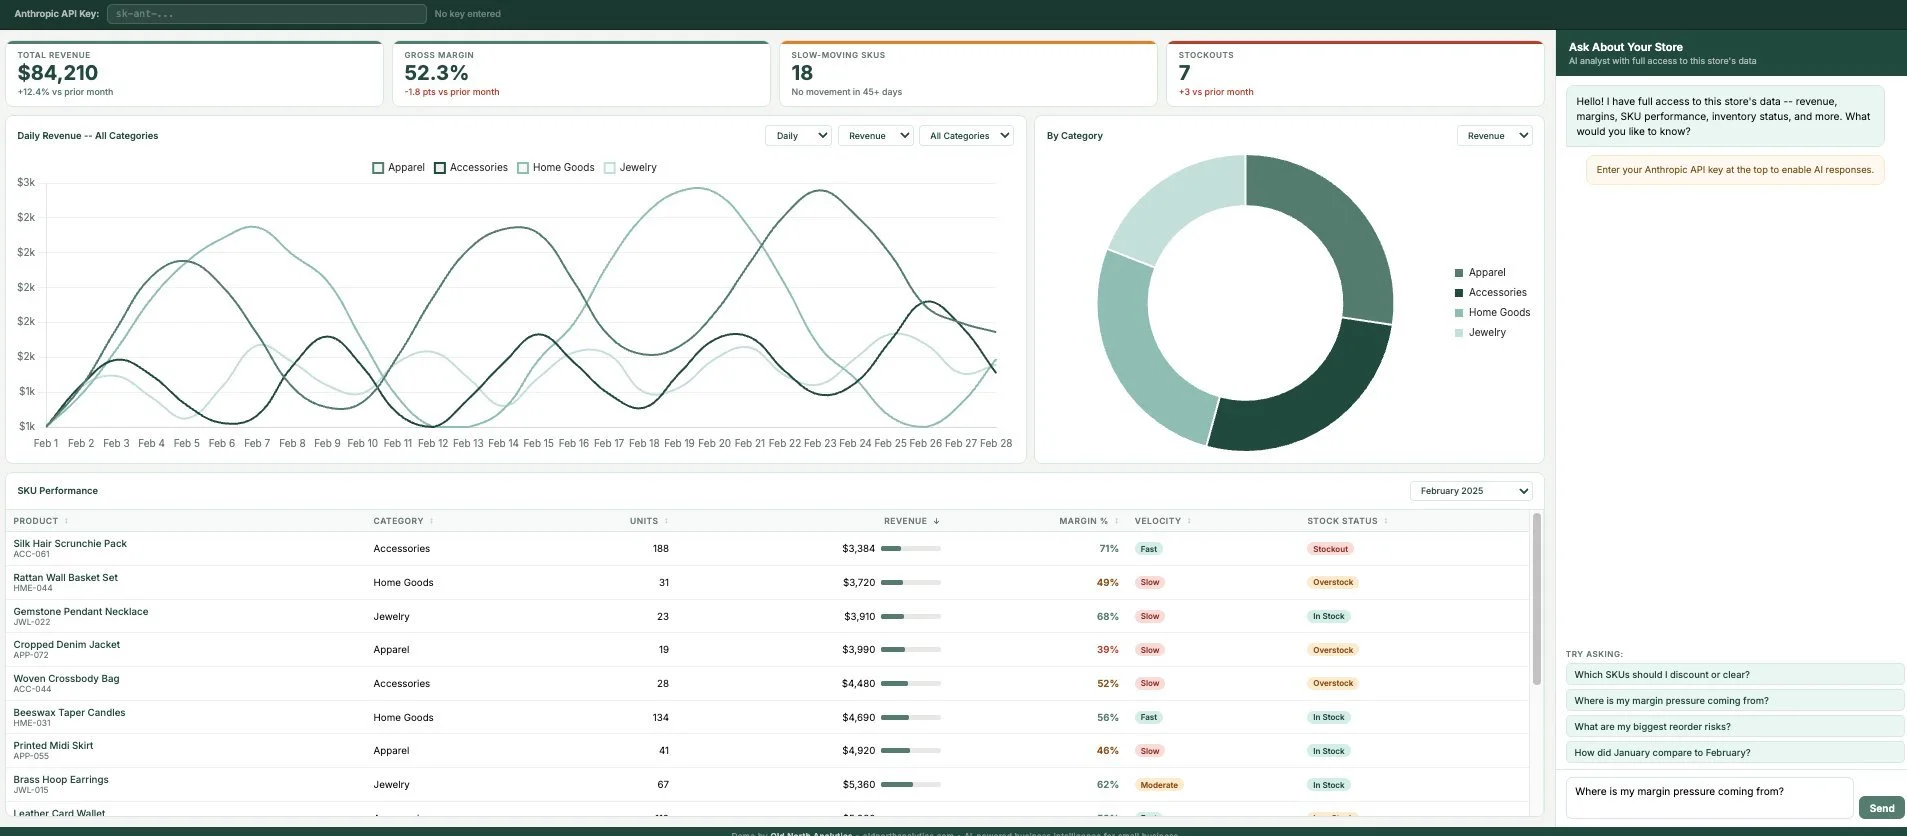
Revenue and the margin behind it sit side by side, by product and by channel, so you read the whole picture at once.
Every line shows what it actually earns after cost, so you know which products to push and which to drop.
Stock on hand sits next to how fast it moves, so reorders happen on time and dead stock stops hiding.
Drop in this week's export and the whole dashboard updates, so the weekly read takes a minute instead of an afternoon.
Proof
A working example you can click through.
We built a retail analytics dashboard for a shop owner who had plenty of sales data and no fast way to read it. It pulls revenue and margin together by product and channel, with a plain-English query box so you can ask a question and get the number back without building a report. The live demo runs on sample data, so you can open it and try it yourself.
How it works
How the work goes.
A short call to understand your store and where your current reporting falls short.
You get a clear deliverable and a fixed price before any work starts, so there is no open meter.
We build the dashboard, then load your real data and walk you through it until you can run it without us.
If something changes down the road we are here, but you are never locked into anything.
Get in touch
Let's figure out if this fits.
Tell us what your current reporting looks like and where it is costing you time. We will give you a straight read on whether a custom dashboard makes sense for your store. Reach out directly. No intake forms, no commitment.
Start a conversation